Discount Rates Tripled. Liabilities Halved. So Why Are Some Schemes Still In Deficit?
by Patrick Lee on 09 Mar 2026 in categories actuarial pensions with tags AI data productivityIn 2021, BT's pension obligation was £60bn. Today, it's £37bn — a £23bn reduction. Yet its deficit only improved from £5.1bn to £4.1bn. How did a 38% fall in liabilities translate into just a 20% improvement in the deficit?
In my first post, I used AI to extract and compare IAS 19 pension disclosures from four FTSE companies — BT, BAE Systems, Tesco, and BP. That was a snapshot: one year, four companies, a proof of concept.
This time I've gone deeper. I expanded to 12 FTSE companies and built time series going back up to five years — capturing the full before-and-after of the 2022 gilt yield crisis. The headline numbers are dramatic: UK discount rates roughly tripled (from ~1.5% to ~5.5%), and defined benefit obligations shrank by tens of billions of pounds. But the story is far more nuanced than "rates up, liabilities down."
The key lies in a metric I've derived from public data that, as far as I can tell, nobody else is routinely computing from annual report disclosures: the hedge ratio.
The rate surge in context
UK pension discount rates went from ~1.5% (2020) to ~5.5% (2024/25) — roughly a 400 basis point increase over four years. The bulk of the move (~250–300bp) happened in a single year, 2022, accelerated by the September mini-budget.
For December 2024 year-ends, UK scheme discount rates now cluster in a remarkably tight band: 5.44% (Barclays) to 5.55% (Lloyds). March 2025 year-ends are slightly higher (5.70–5.75%) reflecting late-March gilt yields. The profession is effectively pricing off the same curve.
The impact on liabilities was enormous. DBOs fell 6–16% in the most recent year alone across all 12 companies. Across my sample, total DBOs shrank from roughly £267bn to £237bn — a ~£30bn reduction in the most recent year alone, on top of much larger falls in 2022.
So far, so straightforward. But the net position — the number that actually matters — tells a very different story depending on which company you look at.
The hedge ratio: a single number that explains everything
Every IAS 19 disclosure includes OCI (Other Comprehensive Income) remeasurements. These break out how much of the change in assets and liabilities came from financial assumption changes — primarily interest rates. By comparing asset sensitivity to liability sensitivity, you can compute how well a scheme's investment portfolio tracks its liabilities when rates move.
I call this the hedge ratio: asset loss from rate movements divided by liability gain from rate movements, expressed as a percentage. A hedge ratio of 100% means perfect tracking — if rates rise and liabilities fall by £1bn, assets also fall by £1bn, and the net position is unchanged. Below 100% means the assets aren't fully tracking liabilities (under-hedged). Above 100% means the assets have more rate sensitivity than the liabilities — typically because of leveraged LDI.
This is derivable from public OCI data. You don't need access to scheme accounts or investment reports. Yet it's arguably the single most revealing metric for understanding pension risk.
Here's what it shows for my original four companies:
Four companies, four hedge ratios, four completely different outcomes
BP — hedge ratio 98%: the benchmark
| Dec 2021 | Dec 2022 | Dec 2023 | Dec 2024 | |
|---|---|---|---|---|
| DBO ($bn) | 49.9 | 29.5 | 31.6 | 28.9 |
| Plan assets ($bn) | 54.0 | 33.5 | 33.6 | 31.4 |
| Net surplus ($bn) | +4.1 | +4.0 | +2.0 | +2.6 |
| UK discount rate | 1.8% | 5.0% | 4.8% | 5.5% |
Despite a 41% collapse in DBO ($49.9bn to $29.5bn in a single year), BP's surplus barely changed — $4.1bn to $4.0bn. Assets and liabilities fell in near-perfect lockstep. A 98% hedge ratio means almost all rate sensitivity was matched. This is the benchmark for how LDI should work. When the hedge ratio is right, even extreme market moves pass through harmlessly.
BT — hedge ratio 121%: over-hedged
| Mar 2021 | Mar 2022 | Mar 2023 | Mar 2024 | Mar 2025 | |
|---|---|---|---|---|---|
| DBO (£bn) | 59.7 | 56.1 | 42.9 | ~41.4 | 36.9 |
| Plan assets (£bn) | 54.6 | 54.9 | 39.8 | ~36.6 | 32.8 |
| Net deficit (£bn) | (5.1) | (1.1) | (3.1) | ~(4.8) | (4.1) |
| Discount rate | ~1.9% | 2.75% | 4.85% | 4.90% | 5.75% |
BT's DBO fell 38% over four years — from £59.7bn to £36.9bn. Yet the deficit only improved by 20% (from £5.1bn to £4.1bn). Why?
BT's leveraged LDI portfolio had more rate sensitivity than the liabilities it was hedging. In the year to March 2023, asset losses from rate movements (£14.9bn) exceeded liability gains (£12.3bn) by £2.6bn. Rate rises, which should have helped, actually widened the deficit.
BT's pension story is one of volatility, not resolution — a rollercoaster driven by over-hedging.
Tesco — hedge ratio 124%: also over-hedged
| Feb 2022 | Feb 2023 | Feb 2024 | Feb 2025 | |
|---|---|---|---|---|
| DBO (£bn) | 19.5 | ~13.7 | 12.8 | 12.0 |
| Plan assets (£bn) | 22.4 | ~13.3 | 12.2 | 11.7 |
| Net position (£bn) | +2.8 | (0.4) | (0.6) | (0.2) |
| Discount rate | 2.8% | 4.9% | 5.1% | 5.7% |
The most counterintuitive result. Tesco went from a £2.8bn surplus to a £0.4bn deficit in a single year, despite discount rates nearly doubling (2.8% to 4.9%). With a 124% hedge ratio, every 1% rate rise reduced liabilities by X but reduced assets by 1.24X — destroying value on a net basis. Over-hedging via leveraged LDI means rate rises hurt rather than help.
BAE Systems — hedge ratio 53%: under-hedged
| Dec 2021 | Dec 2022 | Dec 2023 | Dec 2024 | |
|---|---|---|---|---|
| Total DBO (£bn) | ~25.8 | 23.9 | 22.6 | 19.6 |
| Total assets (£bn) | ~23.5 | 25.3 | 23.4 | 20.7 |
| Net position (£bn) | (2.3) | +1.5 | +0.7 | +1.2 |
| UK discount rate | 1.9% | 4.8% | 4.5% | 5.5% |
The most dramatic swing — from £2.3bn deficit to £1.5bn surplus in one year. But this wasn't skilful management — it was an under-hedged position that got lucky. When rates surged, group liabilities fell by £11.8bn but assets only fell by £6.3bn. BAE's asset portfolio simply wasn't tracking its liabilities.
If rates had fallen by the same amount, the deficit would have roughly tripled to ~£7.8bn. What looks like a turnaround was actually an unhedged bet that happened to pay off.
The full picture: all 12 hedge ratios
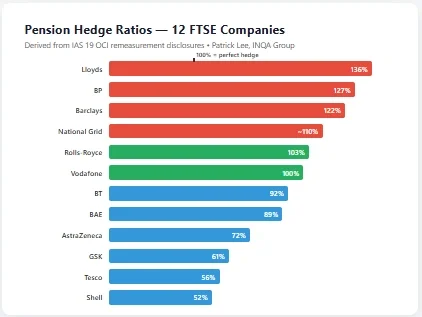
I computed the same metric for all 12 companies. The results split cleanly into three groups:
| Company | Hedge ratio | Category | What happened |
|---|---|---|---|
| Lloyds | 136% | Over-hedged | Surplus eroded despite falling liabilities |
| BP | 127% | Over-hedged | UK LDI programme now over-hedged |
| Barclays | 122% | Over-hedged | Surplus eroded despite falling liabilities |
| National Grid | ~110% | Mildly over-hedged | Surplus stable (approximate — FX effects in mixed UK/US portfolio) |
| Rolls-Royce | 103% | Well-hedged | Near-neutral impact from rate movements |
| Vodafone | 100% | Perfectly hedged | Assets and liabilities moved in lockstep |
| BT | 92% | Under-hedged | De-leveraged since 2022; deficit slowly improving |
| BAE | 89% | Under-hedged | Surplus preserved by moderate under-hedging |
| AstraZeneca | 72% | Under-hedged | Deficit reduced (benefited from rate rises) |
| GSK | 61% | Under-hedged | Deficit reduced dramatically over 3 years |
| Tesco | 56% | Under-hedged | De-leveraged since 2022; deficit narrowing |
| Shell | 52% | Under-hedged | Surplus grew (benefited from rate rises) |
Hedge ratios computed from OCI remeasurement disclosures: |asset return excl. interest income| / |actuarial gain from financial assumptions on DBO|. Figures based on each company's most recent annual report (2024 or 2025 year-end). Note: these ratios reflect current investment strategies; some companies (notably BT and Tesco) were significantly more hedged in 2022 when the large rate moves occurred — see narrative sections below.
The pattern is striking. Five companies show hedge ratios above 100%, with Lloyds the most extreme at 136%. At the other end, seven companies are under-hedged — their pension positions are effectively making unhedged bets on the direction of interest rates.
What's particularly interesting is that the picture has shifted since 2022. BT and Tesco, which were over-hedged during the gilt crisis (121% and 124% respectively in the year of the big rate move), have since de-leveraged to 92% and 56%. BP has moved the other way — from 98% in 2022 to 127% now. Investment strategies are not static.
Only three companies — Rolls-Royce, Vodafone, and BAE — sit in the 89–103% zone where rate movements pass through without materially affecting the net position.
The leveraged LDI cluster
The companies with hedge ratios above 120% — Lloyds, BP, and Barclays — all share the hallmarks of leveraged LDI: their assets have more interest rate sensitivity than their liabilities.
Lloyds at 136% is the most extreme case in my sample. In 2024, rising rates reduced Lloyds' pension obligations by £2.7bn — but asset losses were £3.7bn. The over-hedging cost £1.0bn on the financial assumptions line alone. Other factors (contributions, experience gains) clawed back some of that, but the surplus still fell from £3.5bn to £2.9bn despite everything moving in what should have been the "right" direction.
The mechanism is visible in Lloyds' asset allocation: 75% of scheme assets are in government bonds (23% fixed-interest, 52% index-linked). The fixed-interest gilts hedge nominal rate movements; the index-linked gilts hedge real rates and inflation. But the combined portfolio has more rate sensitivity than the liabilities it's matching — the hallmark of leveraged LDI, where schemes use repo and swap overlays to amplify their hedging beyond 100%.
BP at 127% is a new entrant to the over-hedged club. In the 2022 rate surge, BP's hedge ratio was 98% — near-perfect. But its most recent OCI shows asset losses of $2.5bn against liability gains of $2.0bn. The UK plan alone shows an even more extreme 160% ratio ($2.4bn asset loss vs $1.5bn liability gain). BP appears to have increased its LDI leverage, particularly through its extensive gilt repo programme ($5.7bn of repo debt funding index-linked and nominal gilts).
Barclays at 122% tells a similar story — asset losses of £2.2bn against liability gains of £1.8bn. Like Lloyds, Barclays can afford the drag because of its substantial surplus (£3.0bn). But the over-hedging cost approximately £400m in the year.
The banking sector's over-hedging is no accident. UK bank pension schemes have historically pursued aggressive LDI strategies, often using gilt repo, interest rate swaps, and inflation swaps to amplify their liability-matching exposure beyond 100%. The logic was that in a falling-rate environment, over-hedging provides extra protection. But rates didn't fall — they tripled. And the leverage worked in reverse.
BT and Tesco were also over-hedged in 2022 (121% and 124% respectively) — but have since de-leveraged significantly. BT's most recent hedge ratio is 92% and Tesco's is 56%. The 2022 gilt crisis may have prompted a strategic rethink. This is an important observation: hedge ratios are not fixed. Investment strategies evolve, and a company that was over-hedged during the crisis may have a very different risk profile today.
Rolls-Royce provides an interesting contrast. Its OCI-derived hedge ratio is 103% — almost perfect. But its sensitivity disclosure tells a different story: a 0.25% decrease in discount rates would increase obligations by £145m while increasing LDI assets by £179m. That's a forward-looking hedge ratio of 123%. This suggests Rolls-Royce may have increased its LDI leverage during 2024, moving from a well-hedged to an over-hedged position — something to watch in future disclosures.
The under-hedged: lucky, not skilful
At the other end, Shell (52%), Tesco (56%), GSK (61%), AstraZeneca (72%), BAE (89%), and BT (92%) are all currently under-hedged — their assets have less rate sensitivity than their liabilities. When rates rose, this worked in their favour: assets didn't fall as much as liabilities, so net positions improved.
But this cuts both ways. If rates reverse, these schemes would be the most exposed. An under-hedged scheme that benefits from rising rates is not demonstrating good risk management — it's demonstrating that an uncontrolled exposure happened to move in a favourable direction.
Shell's 52% hedge ratio is particularly notable given its size ($66bn DBO, the largest in my sample). When rates rose, Shell's liabilities fell by $4.4bn from financial assumption changes, but assets only fell by $2.3bn — a $2.1bn windfall. Shell's surplus grew from $1.6bn to $3.3bn. But with only half the rate sensitivity matched, a rate reversal would be painful.
The bigger picture: de-risking and the end of DB
Stepping back from hedge ratios, the broader picture across all 12 companies is one of structural transformation:
Seven companies now show net pension surpluses — Shell, BAE, BP, Lloyds, Barclays, Vodafone, and National Grid. Three years ago, the majority were in deficit.
Only BT and AstraZeneca have material deficits — BT at £4.1bn and AstraZeneca at $1.2bn. Everyone else is either in surplus or near balance (GSK at 99% funded, Tesco and Rolls-Royce just below 100%).
De-risking has reached the end-game. Shell executed a $5.1bn pension buy-out in 2024. National Grid has 31% of its UK assets in annuity policies. GSK has a £340m buy-in covering one plan. AstraZeneca has a longevity swap covering $2.2bn of liabilities. Barclays expects zero employer contributions in 2025. The direction is clear — UK defined benefit pensions are being systematically wound down via insurance market transfer.
DC has won. Where both costs are disclosed, defined contribution pension costs now exceed defined benefit costs at every single company in my sample. Lloyds: £537m DC vs a net DB credit. Shell: $514m DC vs $295m DB. The structural shift to DC is complete — DB is purely a legacy obligation being run off.
The current net position across all 12 companies
| Company | Net position | Funded ratio | Hedge ratio | Annual contributions |
|---|---|---|---|---|
| Shell | +$3.3bn | 105% | 52% | $409m |
| BAE Systems | +£1.2bn | 106% | 89% | £407m |
| Barclays | +£3.0bn | 115% | 122% | £37m |
| BP | +$2.6bn | 109% | 127% | $69m |
| Lloyds | +£2.9bn | 111% | 136% | £172m |
| Vodafone | +£0.1bn | 101% | 100% | £41m |
| National Grid | +£1.9bn | 114% | ~110% | £282m |
| GSK | −£0.1bn | 99% | 61% | £351m |
| Tesco | −£0.2bn | 98% | 56% | £40m |
| Rolls-Royce | −£0.2bn | 97% | 103% | £74m |
| AstraZeneca | −$1.2bn | 83% | 72% | $166m |
| BT Group | −£4.1bn | 89% | 92% | £856m |
What actuaries should know
The hedge ratio — derivable from public OCI data in any IAS 19 disclosure — is arguably the single most revealing metric for understanding pension risk. It explains why BP sailed through the gilt crisis while BT and Tesco didn't. It reframes BAE's apparent "turnaround" as an unhedged bet. It reveals that Lloyds' £27bn pension scheme has more rate sensitivity in its assets than in its liabilities. And it's not something I've seen routinely computed from annual report data.
Five of 12 companies currently show hedge ratios above 100%, consistent with leveraged LDI. But the picture is evolving. BT and Tesco, which were significantly over-hedged during the 2022 gilt crisis, have since de-leveraged — while BP has moved from well-hedged to over-hedged. The September 2022 crisis exposed the risks of leveraged LDI when it triggered collateral calls across the UK pension sector, and some schemes clearly responded by reducing their leverage. But the OCI data shows that over-hedging has not disappeared — it has simply migrated.
The disclosure gap around leverage is a problem. The hedge ratio I'm computing from OCI data is effectively a backdoor into information that should be disclosed directly but isn't. Some companies are transparent: BP explicitly shows $5.7bn of repo debt in its asset table, and Tesco breaks out £3.3bn in repo agreements and swaps within its LDI portfolio. But Lloyds buries £(8.1)bn in a single "money market, cash, derivatives, other" line with no decomposition. Barclays shows derivatives of £(1.8)bn without further detail. There is no IAS 19 requirement to disclose the degree of leverage or the instruments creating it.
This matters because leverage fundamentally changes the risk character of a pension scheme. When I was an investment partner at Watson Wyatt in 1994 to 1995 — and their in-house expert on derivatives — I used to advise pension plan trustees against any form of gearing. My view then, and now, is that pension plan assets should never be in a position where they could become negative. Under leverage, that is theoretically possible: if markets move far enough against the leveraged position, the borrowed obligations can exceed the asset value. A pension scheme is supposed to be a pool of assets backing promises to retirees. Leverage turns it into something closer to a hedge fund.
The OCI-derived hedge ratio makes this visible from public data. But it shouldn't require reverse-engineering. The degree of leverage — gross and net exposure, by instrument type — ought to be a standard IAS 19 disclosure.
This kind of cross-company, multi-year analysis is exactly the sort of work that used to take weeks. I built this dataset — 12 companies, up to five years of data, full extraction of assumptions, balance sheets, income statements, contributions, asset allocations, sensitivities, and membership — in a few hours using AI-assisted extraction from publicly available PDFs. The extraction prompt is reusable: point it at any company's annual report and it pulls out the same structured dataset.
The data behind this analysis is available as a premium download for INQA members — the full 12-company time series dataset, individual company extraction files, and the reusable extraction prompt template.
What's next
I'm planning to extend the time series to five years for all 12 companies (currently I have five years for BT, BAE, and BP; four for Tesco; two to three for the rest). I'd also like to add more companies and build an automated extraction pipeline.
If there's a specific company or analysis you'd like to see, let me know.
And if you haven't taken INQA's AI skills baseline assessment yet, it takes about 5 minutes and gives you a personalised score: Take the assessment
All data extracted from publicly available annual reports (2020–2025). No proprietary data was used. Analysis assisted by Claude (Anthropic). Hedge ratios computed from OCI remeasurement disclosures.