I Used AI to Compare Pension Disclosures Across 4 FTSE Companies. Here's What I Found.
by Patrick Lee on 03 Mar 2026 in categories actuarial pensions with tags AI economics productivityFour out of five respondents to INQA's AI skills assessment flagged reserving and valuation as the area where they most want to use AI but don't know how. That's a clear signal — so rather than writing about it in theory, I decided to test it.
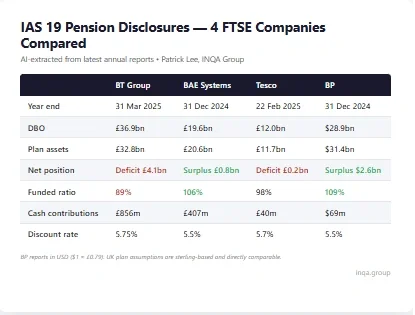
I took four FTSE companies — BT Group, BAE Systems, Tesco, and BP — downloaded their latest annual reports, and used AI to extract and compare their IAS 19 pension disclosures. The whole process, from downloading the first PDF to having a completed comparison table, took about an hour.
Here's what I found — and what it tells us about using AI for actuarial analysis.
The process
The pipeline was straightforward:
- Download annual reports — financial statements PDFs from each company's investor relations page (BT, Tesco) or from companiesmarketcap.com (BAE, whose site blocks automated downloads)
- Extract pension disclosure data — using a standardised prompt template that asks for 20+ data points across assumptions, balance sheet, income statement, contributions, asset allocation, sensitivities, and membership
- Normalise and compare — bringing the four extractions into a single comparison table, adjusting for different year ends, age bases, sensitivity increments, and currencies
The extraction prompt template is reusable — point it at any UK company annual report and it pulls out the same structured dataset. That's the bit that makes this scalable.
The headline numbers
| BT Group | BAE Systems | Tesco | BP | |
|---|---|---|---|---|
| Year end | 31 Mar 2025 | 31 Dec 2024 | 22 Feb 2025 | 31 Dec 2024 |
| DBO | £36.9bn | £19.6bn | £12.0bn | $28.9bn |
| Plan assets | £32.8bn | £20.6bn | £11.7bn | $31.4bn |
| Net position | Deficit £4.1bn | Surplus £0.8bn | Deficit £0.2bn | Surplus $2.6bn |
| Funded ratio | 89% | 106% | 98% | 109% |
| Annual cash contributions | £856m | £407m | £40m | $69m |
| Discount rate | 5.75% | 5.5% | 5.7% | 5.5% |
BP reports in USD ($1 ≈ £0.79 at 31 Dec 2024). Its UK plan assumptions (discount rate, inflation, mortality) are sterling-based and directly comparable to the other three companies — only the monetary amounts are translated.
Six things that stand out
1. BT is an outlier
BT's pension scheme dominates the picture — a £4.1bn deficit with annual cash contributions of £856m, scheduled to continue at £780m pa until 2030. The other three companies are in or near surplus. BT's cash outflow is dominated by deficit repair contributions (£803m of the £856m total) — a direct consequence of the shortfall. By contrast, Tesco's scheme is nearly fully funded and requires just £40m a year.
2. Discount rates converge
All four companies use discount rates in a tight 5.5%–5.75% band, consistent with the WTW FTSE 100 median of 5.55%. BT's slightly higher rate (5.75%) reflects its later year end — gilt yields rose during Q1 2025. Ironically, that timing works in BT's favour: had it used 5.5% like BAE and BP, its DBO would have been higher and the deficit even larger.
3. Everyone uses CMI 2023
All four companies have adopted CMI 2023 mortality projections (Tesco with a slightly unusual CMI 2020 base projected to 2018, then CMI 2023 for future improvements). Long-term improvement rates range from 1.0% pa (BAE, Tesco) to undisclosed (BT).
4. Life expectancy varies more than you might expect
Male life expectancy at 65 ranges from 19.6 years (Tesco) to approximately 22 years (BP's UK scheme). Female life expectancy shows a similar pattern — 22.2 years at Tesco versus approximately 24 years at BP. The gap is consistent across both sexes, which points to the socio-economic profile of each company's workforce rather than differences in sex mix. Tesco's largely blue-collar scheme population has materially lower longevity than BP's.
BT goes further — splitting life expectancy by "pension bracket" (higher vs lower earners within the same scheme), which explicitly models socio-economic mortality differentials.
5. DC now exceeds DB everywhere
All four companies spend more on defined contribution pensions than on their defined benefit schemes. BT: £305m DC vs £225m DB. Tesco: £454m DC vs £49m DB. Three of the four schemes (BT, Tesco, BP UK) are fully closed to accrual — reflecting past service only. BAE is the exception: its scheme is closed to new entrants but existing members are still accruing benefits, which is why its current service cost (£134m) is roughly 10x higher than BT's or Tesco's.
6. De-risking is universal
Growth asset allocations range from approximately 25% (BP) to 45% (Tesco). LDI strategies, longevity hedging, and cash flow matching are in place across all four schemes. BP has the most defensive allocation — 48% in index-linked government bonds alone.
A question worth asking: given the likely significant disruption to the economy from AI over the next decade — arguably earlier — are index-linked government bonds really going to remain low risk? What happens to sovereign creditworthiness when income tax receipts fall significantly? The de-risking consensus assumes a continuity that AI may not deliver.
Key assumptions comparison
| Assumption | BT | BAE | Tesco | BP |
|---|---|---|---|---|
| Discount rate | 5.75% | 5.5% | 5.7% | 5.5% |
| RPI inflation | 3.10% | 2.9% | 3.0% | 3.1% |
| CPI inflation | 2.60% | 2.3% | ~2.6% | — |
| Mortality model | CMI 2023 | CMI 2023 | CMI 2023 | Not specified |
| Male LE at 65 | ~20–22 yrs | 20–23 yrs | 19.6 yrs | ~22 yrs |
BT and Tesco both disclose bifurcated RPI/CPI assumptions reflecting the 2030 RPI reform (when RPI will be aligned with CPIH, narrowing the RPI-CPI gap significantly) — a nuance that older analyses would miss.
What AI can and can't do here
What worked well:
- Extracting structured data from narrative pension notes — AI handles this faster and more consistently than manual reading
- Identifying which note contains the IAS 19 disclosures and pulling the right pages
- Producing structured markdown that's easy to compare across companies
What needed human judgement:
- Normalising across different disclosure formats (BAE quotes life expectancy as absolute age, not years remaining; BT presents sensitivities as charts, not tables; BP reports in USD)
- Spotting subtleties like Tesco's unusual CMI base year treatment
- Deciding which figures to use when companies have multiple schemes or report at different levels (UK only vs total group)
This isn't "AI replaces the actuary." It's "AI does the extraction in minutes instead of hours, so the actuary can focus on the analysis."
Why this matters for actuaries
Comparative IAS 19 analysis is a consulting product. Firms charge real money to produce benchmarking reports that look a lot like the table above. The data is all public — it's just time-consuming to extract manually.
With a reusable extraction prompt and an hour of time, I produced a comparison across four major companies. Scaling to 10 or 20 companies would take proportionally longer but the process is the same. Adding historical years to show trends over time is the obvious next step.
If you're an actuary who's been wondering what AI could actually do in your day-to-day work — this is a concrete example. Not hypothetical, not a toy demo. Real data, real companies, real findings.
What's next
I'm planning to expand this to more companies and add time series data. If there's a specific company or comparison you'd like to see, let me know.
And if you haven't taken INQA's AI skills baseline assessment yet, it takes about 5 minutes and gives you a personalised score: Take the assessment
All data extracted from publicly available annual reports (BT Group FY 2024/25, BAE Systems FY 2024, Tesco FY 2024/25, BP FY 2024). No proprietary data was used. Analysis assisted by Claude (Anthropic).